Star Plot - Also referred to as radar plots, this is a plot that can be more effective than a multiple bar chart for comparing small amounts of multivariate data.
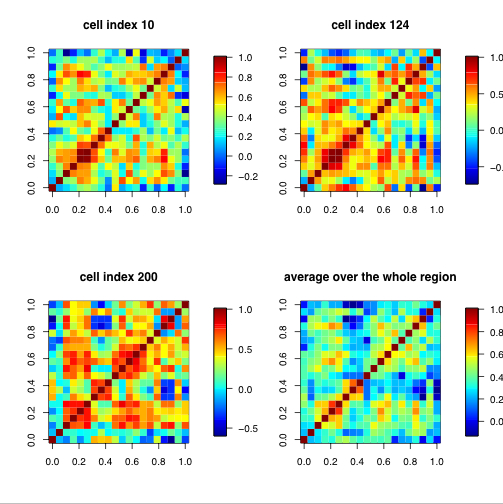
Correlation Matrix - A Correlation matrix describes correlation among M variables. It is a square symmetrical matrix with the element equal to the correlation coefficient between variables. The diagonal elements (correlations of variables with themselves) are always equal to 1.00.
Stem and Leaf Plot - Stem and leaf plots are a way of presenting numerical data. The data found on the left hand side of the solid line is considered the stem, and the numbers on the right are the leaves.