Tuesday, November 30, 2010

Star Plot

Star Plot - Also referred to as radar plots, this is a plot that can be more effective than a multiple bar chart for comparing small amounts of multivariate data.

Correlation Matrix

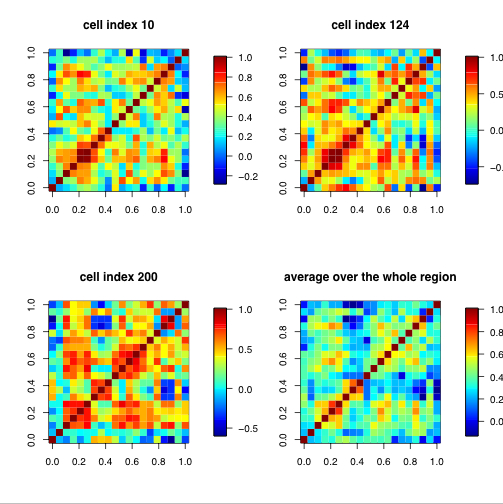
Correlation Matrix A Correlation matrix describes correlation among M variables. It is a square symmetrical matrix with the element equal to the correlation coefficient between variables. The diagonal elements (correlations of variables with themselves) are always equal to 1.00.

Similarity Matrix

Similarity Matrix - A similarity matrix is a matrix of scores which express the similarity between two data points.

Stem and Leaf Plot

Stem and Leaf Plot - Stem and leaf plots are a way of presenting numerical data. The data found on the left hand side of the solid line is considered the stem, and the numbers on the right are the leaves.

Box Plot

Box Plot - graphically depicts groups of numerical data through their five-number summaries.

Histogram

Histogram - chart that shows frequencies of a particular recorded data.

Parallel Coordinate Graph

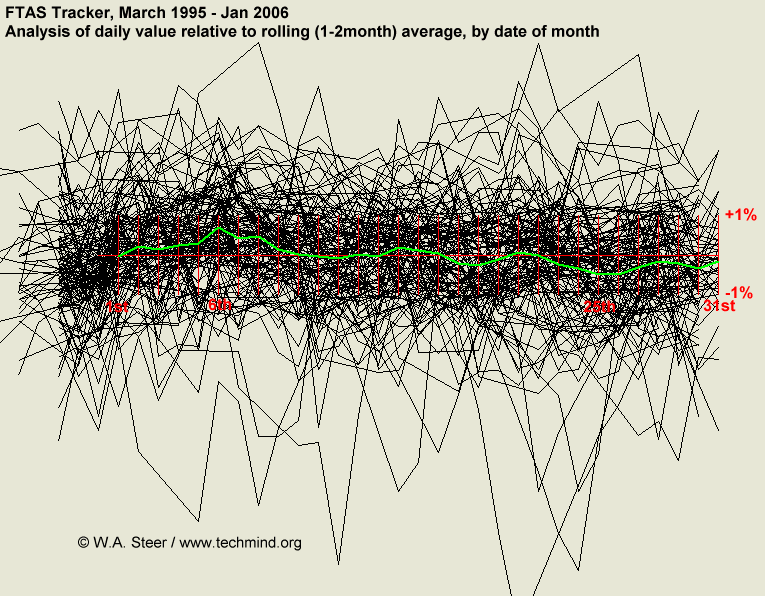
Parallel Coordinate Graph - used to display numerous amounts of datasets.

Triangular Plot

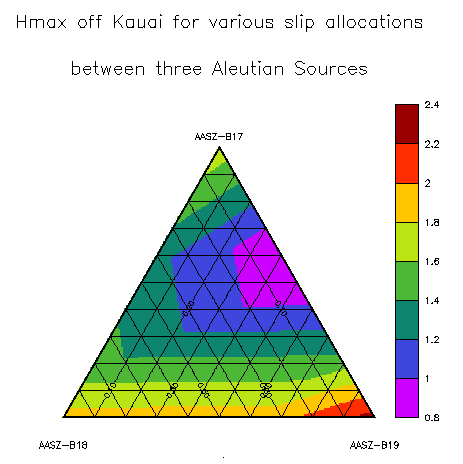
Triangular Plot - a map that graphically depicts the ratios of the three variables as positions in an equilateral triangle.

Windrose

Windrose - a graphic tool used by meteorologists to give a succinct view of how wind speed and direction are typically distributed at a particular location.

Climograph

Climograph - combines information about a locales monthly precipitation and relating temperature conditions.

Population Profile

Population Profile - displays the age distribution and corresponding size of a population.

Scatter Plot

Scatter Plot - displays the values  of a dataset on a graph with two axis of variables.

Index Value Plot

Index Value Plot - plots distance against the corresponding observation number in the dataset.

Lorenz Curve/Accumulative Line Graph

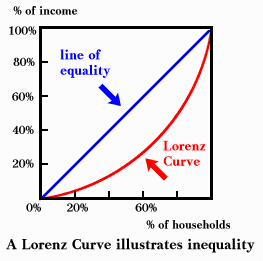
Lorenz Curve/Accumulative Line Graph - demonstrates the income curve of a specific population.

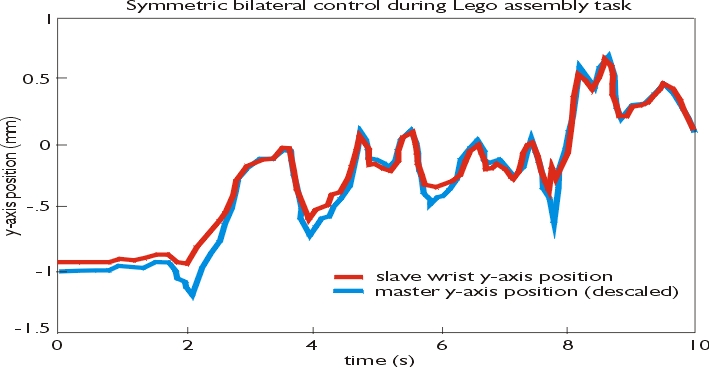
Bilateral Graph

Bilateral Graph - type of visualization graph that depicts two relate-able variables.

Nominal Area Choropleth Map

Nominal Area Choropleth Map - Displays qualitative information over a geographic area.

Unstandardized Choropleth Map

Unstandardized Choropleth Map - Unordered maps with no specific ranking assigned to the class; no one category is higher or lower than another.

Standardized Choropleth Map

Standardized Choropleth Map - data is standardized to allow for comparisons of distribution among different areas.

Univariate Choropleth Map

Univariate Choropleth Map - displays a single data set.

Bivariate Choropleth Map

Bivariate Choropleth Map - two univariate choropleth maps displayed side by side and allows a reader to visualize two different  variables to the same space.

Unclassed Choropleth Map

Unclassified choropleth map showing fertility rates in Europe.
Unclassed Choropleth Map -  the numeric attribute values are converted directly into proportional degrees of darkness. 

Classed Choropleth Map

Classed Choropleth Map - A classed choropleth map is a particular type of choropleth map that uses smaller intervals to portray data.  It is broken down into a scale and presented using colored intervals.

Range Graded Proportional Circle Map

Range Graded Proportional Circle Map - data is divided into groups using classification procedures common to choropleth mapping. The design goal is for symbol size discrimination, rather than magnitude estimation. The cartographer chooses symbol sizes for adjacent classes so that the map reader can easily distinguish between circle sizes, and therefore, categories.

http://www.neiu.edu/~ejhowens/377/examples.htm - Mexican population with spheres/volumes.

Continuously Variable Proportional Circle Map

Continuously Variable Proportional Circle Map - map that utilizes circles to create point data.  the circles are in proportion to the variable bring measured.

DOQQ

DOQQ - Digital Orthophoto Quarter Quad - aerial photo that is geometrically corrected so that the scale is uniform.  An orthophotograph can be used to measure true distance as it is an accurate representation of the Earths surface.

DEM

DEM - Digital Elevation Model - a digital representation of ground surface or terrain.