Star Plot - Also referred to as radar plots, this is a plot that can be more effective than a multiple bar chart for comparing small amounts of multivariate data.
Tuesday, November 30, 2010
Correlation Matrix
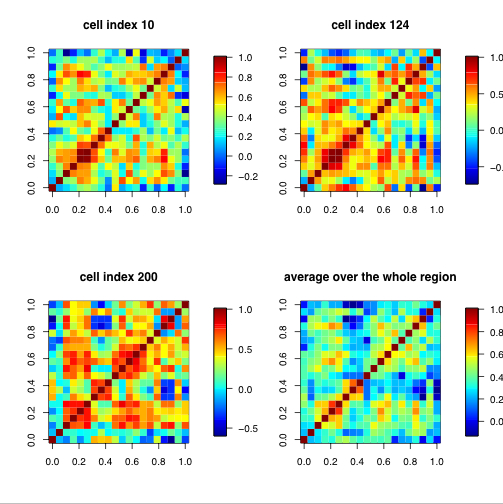
Correlation Matrix - A Correlation matrix describes correlation among M variables. It is a square symmetrical matrix with the element equal to the correlation coefficient between variables. The diagonal elements (correlations of variables with themselves) are always equal to 1.00.
Similarity Matrix
Similarity Matrix - A similarity matrix is a matrix of scores which express the similarity between two data points.
Stem and Leaf Plot
Stem and Leaf Plot - Stem and leaf plots are a way of presenting numerical data. The data found on the left hand side of the solid line is considered the stem, and the numbers on the right are the leaves.
Box Plot
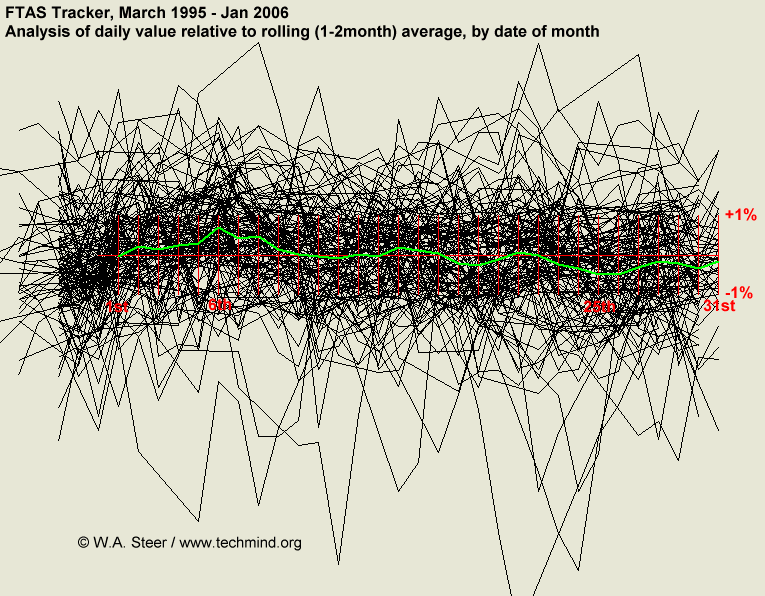
Box Plot - graphically depicts groups of numerical data through their five-number summaries.
Triangular Plot
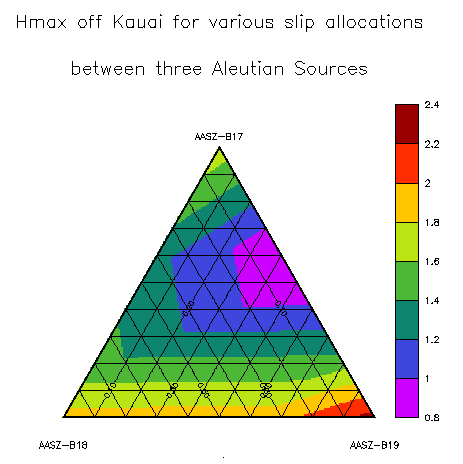
Triangular Plot - a map that graphically depicts the ratios of the three variables as positions in an equilateral triangle.
Windrose
Windrose - a graphic tool used by meteorologists to give a succinct view of how wind speed and direction are typically distributed at a particular location.
Climograph
Climograph - combines information about a locales monthly precipitation and relating temperature conditions.
Population Profile
Population Profile - displays the age distribution and corresponding size of a population.
Index Value Plot
Index Value Plot - plots distance against the corresponding observation number in the dataset.
Lorenz Curve/Accumulative Line Graph
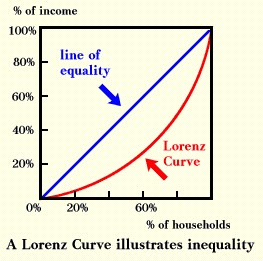
Lorenz Curve/Accumulative Line Graph - demonstrates the income curve of a specific population.
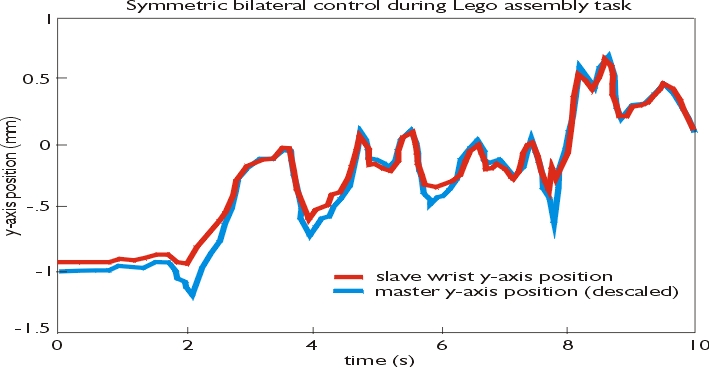
Bilateral Graph
Bilateral Graph - type of visualization graph that depicts two relate-able variables.
Nominal Area Choropleth Map
Nominal Area Choropleth Map - Displays qualitative information over a geographic area.
Unstandardized Choropleth Map
Unstandardized Choropleth Map - Unordered maps with no specific ranking assigned to the class; no one category is higher or lower than another.
Standardized Choropleth Map
Standardized Choropleth Map - data is standardized to allow for comparisons of distribution among different areas.
Bivariate Choropleth Map
Bivariate Choropleth Map - two univariate choropleth maps displayed side by side and allows a reader to visualize two different variables to the same space.
Unclassed Choropleth Map
Unclassed Choropleth Map - the numeric attribute values are converted directly into proportional degrees of darkness.
Classed Choropleth Map
Classed Choropleth Map - A classed choropleth map is a particular type of choropleth map that uses smaller intervals to portray data. It is broken down into a scale and presented using colored intervals.
Range Graded Proportional Circle Map
Range Graded Proportional Circle Map - data is divided into groups using classification procedures common to choropleth mapping. The design goal is for symbol size discrimination, rather than magnitude estimation. The cartographer chooses symbol sizes for adjacent classes so that the map reader can easily distinguish between circle sizes, and therefore, categories.
http://www.neiu.edu/~ejhowens/377/examples.htm - Mexican population with spheres/volumes.
Continuously Variable Proportional Circle Map
Continuously Variable Proportional Circle Map - map that utilizes circles to create point data. the circles are in proportion to the variable bring measured.
DOQQ
DOQQ - Digital Orthophoto Quarter Quad - aerial photo that is geometrically corrected so that the scale is uniform. An orthophotograph can be used to measure true distance as it is an accurate representation of the Earths surface.
Thursday, September 16, 2010
Topographic Map
Topographic Map - Shows elevation change of a geographical area.
http://www.rollanet.org/~conorw/cwome/article5.htm
http://www.rollanet.org/~conorw/cwome/hahatonka_topo_map.jpg
http://www.rollanet.org/~conorw/cwome/article5.htm
http://www.rollanet.org/~conorw/cwome/hahatonka_topo_map.jpg
Cartographic Animation
Cartographic Animation - Display visual changes of geospatial data of a specific region.
http://uwacadweb.uwyo.edu/JSHINKER/animations/global/
http://uwacadweb.uwyo.edu/JSHINKER/animations/global/gifs/vmag500winds_web.gif
http://uwacadweb.uwyo.edu/JSHINKER/animations/global/
http://uwacadweb.uwyo.edu/JSHINKER/animations/global/gifs/vmag500winds_web.gif
Mental Map
Mental Map - Maps from a persons point of view as they see the world.
http://www.uky.edu/~ulack/Geo152/
http://www.uky.edu/~ulack/Geo152/unnumbered%20figure%20pg%2003.jpg
http://www.uky.edu/~ulack/Geo152/
http://www.uky.edu/~ulack/Geo152/unnumbered%20figure%20pg%2003.jpg
Statistical Map
Statistical Map - Used to display a variables distribuition over a geographic region. They can also be displayed using shading techniques or colors to represent certain values.
http://www.floridahurricane.net/
http://www.floridahurricane.net/images/florida-hurricane-strikes-m.gif
http://www.floridahurricane.net/
http://www.floridahurricane.net/images/florida-hurricane-strikes-m.gif
PLSS Map
PLSS Map - Public Land Survey System - A way of describing and subdividing land in the US.
http://www.fairview-industries.com/standardmodule/mn-exmpl.htm
http://www.fairview-industries.com/standardmodule/mn-exmp2.gif
http://www.fairview-industries.com/standardmodule/mn-exmpl.htm
http://www.fairview-industries.com/standardmodule/mn-exmp2.gif
Thematic Map
Thematic Map -Emphasize a particular theme or a special topic.
http://www.creativemappingsolutions.com/maps/thematic/thematic1.html
http://www.creativemappingsolutions.com/maps/thematic/thematic_map_1-web.jpg
Planimetric Map
Planimetric Map - Display the horizontal position of planimetric features by usuing lines and symbols. They use an X,Y coordinate system to help the map reader. Horizontal distances are extremely accurate.
http://www.eserc.stonybrook.edu/Sayville/
http://www.chipr.sunysb.edu/eserc/Sayville/images/sayPlanMap.gif
http://www.eserc.stonybrook.edu/Sayville/
http://www.chipr.sunysb.edu/eserc/Sayville/images/sayPlanMap.gif
Propaganda Map
Propaganda Map -Used to persuade people in to believing on thing or another. These maps have become well known because of their used in WWI and WWII.
http://www.victoriansatwar.net/archives/maps_2.html
http://www.victoriansatwar.net/archives/pics/46.jpg
Cadastral Map
Cadastral Map - Displays exact descriptions of land plots. Plots are usually assigned names or numbers to identify the property. Scale is crucial for accurate identification of property in these maps.
http://www.dgs-gis.cz/mapy.php
http://www.dgs-gis.cz/images/bigones/katastralni.jpg
http://www.dgs-gis.cz/mapy.php
http://www.dgs-gis.cz/images/bigones/katastralni.jpg
DLG (Digital Line Graph)
DLG - Digital Lin Graph - Digital representation of features that are displayed on a US Geological Survey Topo Maps.
DRG (Digital Raster Graphics)
DRG - Digital Raster Graphics - Scanned images of US Geological Survey Topographic maps. Maps are scanned at a minimum resolution of 250 dpi. Maps are georeferenced to the Earths surface to fit the Universal Transverse Mercator Projection.
http://egsc.usgs.gov/isb/pubs/factsheets/fs08801.html
http://egsc.usgs.gov/isb/pubs/factsheets/fs08801.graphics/drg.jpg
Tuesday, September 7, 2010
Isopleths
Isopleths - simplifies and generalizes data with a continuous distribution and shows it as a third dimension on a map.
http://dwb4.unl.edu/chem/chem869v/chem869vlinks/weather.about.com/newsissues/weather/library/weekly/aa071600a.htm
http://dwb4.unl.edu/chem/chem869v/chem869vlinks/nadp.sws.uiuc.edu/isopleths/maps1998/so4.gif
http://dwb4.unl.edu/chem/chem869v/chem869vlinks/weather.about.com/newsissues/weather/library/weekly/aa071600a.htm
http://dwb4.unl.edu/chem/chem869v/chem869vlinks/nadp.sws.uiuc.edu/isopleths/maps1998/so4.gif
Isopach
Isopachs - a contour map that connects points of equal thickness. These usually refer to stratigraphic thickness of a rock group.
http://www.glossary.oilfield.slb.com/DisplayImage.cfm?ID=114
http://www.glossary.oilfield.slb.com/files/OGL98135.gif
http://www.glossary.oilfield.slb.com/DisplayImage.cfm?ID=114
http://www.glossary.oilfield.slb.com/files/OGL98135.gif
Isohyets
Isohyets - contour map connecting areas of equal precipitation.
http://www.virginiaplaces.org/climate/index.html
http://www.virginiaplaces.org/climate/graphics/isohyet.gif
http://www.virginiaplaces.org/climate/index.html
http://www.virginiaplaces.org/climate/graphics/isohyet.gif
Isotachs
Isotachs - A contour map that displays and connects like wind speeds.
http://www4.ncsu.edu/~nwsfo/storage/cases/20030123/
http://www4.ncsu.edu/~nwsfo/storage/cases/20030123/small.eta_12z_300_000hr.gif
http://www4.ncsu.edu/~nwsfo/storage/cases/20030123/
http://www4.ncsu.edu/~nwsfo/storage/cases/20030123/small.eta_12z_300_000hr.gif
Isobars
Isobars - Form of contour map that connects and displays like atmospheric pressure.
http://www.uwlax.edu/faculty/skala/Air-Pressure.htm
http://www.uwlax.edu/faculty/skala/Image58.gif
http://www.uwlax.edu/faculty/skala/Air-Pressure.htm
http://www.uwlax.edu/faculty/skala/Image58.gif
LIDAR
LIDAR - aka Light Detection and Ranging is a form of optical remote sensing and measures properties of scattered light to find range and other information about a distant target.
http://www.noaanews.noaa.gov/stories/s798.htm
http://www.noaanews.noaa.gov/stories/images/manhattan-lidar092701.jpg
LIDAR Image of Manhattan
http://www.noaanews.noaa.gov/stories/s798.htm
http://www.noaanews.noaa.gov/stories/images/manhattan-lidar092701.jpg
LIDAR Image of Manhattan
Doppler Radar
Doppler Radar - uses the Doppler Effect to radially track and measure an objects velocity.
http://www.noaanews.noaa.gov/stories2004/s2311.htm
http://www.noaanews.noaa.gov/stories2004/images/frances-radar-melbourne-fla-090404-0334z2.jpg
The above Doppler image is of Hurricane Francis which hit Florida's east coast September 4, 2004.
Black and White Aerial Photo
Black and White Aerial Photo - Photo displaying large tracts of land that was shot by a flying plane.
http://freegeographytools.com/2007/goofing-around-with-pan-sharpening
http://freegeographytools.com/wp-content/uploads/2007/09/doq-thumb.jpg
Infrared Aerial Photo
Infrared Aerial Photo - Infrared film only picks up light from a specific part of the spectrum. Its used to document changes in environment, wetlands and other geographic features.
http://www.aerialarchives.com/infrared.htm
http://www.aerialarchives.com/imagedb/IR0010154f.jpg
Isoline Map
Isoline Map - Uses contour lines to link like data. Can display elevation, population, rainfall, wind, etc.
http://legacy.sfei.org/ecoatlas/GIS/MapInterpretation/MapsandScales.html
http://legacy.sfei.org/ecoatlas/GIS/MapInterpretation/images/fig219.gif
Flow Map
Flow Map - Shows the progression of ideas, people, and other objects from one place to another.
http://www.mapthemind.com/thinkingmaps/themaps/flow/index.html
http://www.mapthemind.com/thinkingmaps/themaps/flow/images/flow_chapters.gif
The above flow map depicts the chapter by chapter progression of the book "Sarah, Plain and Tall".
Proportional Circle Map
Proportional Circle Map - Information is displayed via the size of the circle.
http://www.creativeclass.com/creative_class/2009/08/
http://www.creativeclass.com/creative_class/_wordpress/wp-content/uploads/2009/08/bailoutmap11.jpg
Above Proportional Circle Map displays by state the amount of funds distributed under the bailout.
http://www.creativeclass.com/creative_class/2009/08/
http://www.creativeclass.com/creative_class/_wordpress/wp-content/uploads/2009/08/bailoutmap11.jpg
Above Proportional Circle Map displays by state the amount of funds distributed under the bailout.
Cartogram
Cartogram - The normal space of a map is distorted to display collected data about a geographical area.
http://www.longwood.edu/staff/hardinds/Politics/Smoke-free_Virginia/SmokeFree2009.htm
http://www.longwood.edu/staff/hardinds/Politics/Smoke-free_Virginia/Majority%20Non-Smoking%202009%20cartogram_jpg.jpg
The above is a cartogram of smoke free restaurants by county in Virginia.
http://www.longwood.edu/staff/hardinds/Politics/Smoke-free_Virginia/SmokeFree2009.htm
http://www.longwood.edu/staff/hardinds/Politics/Smoke-free_Virginia/Majority%20Non-Smoking%202009%20cartogram_jpg.jpg
The above is a cartogram of smoke free restaurants by county in Virginia.
Subscribe to:
Posts (Atom)