Topographic Map - Shows elevation change of a geographical area.
http://www.rollanet.org/~conorw/cwome/article5.htm
http://www.rollanet.org/~conorw/cwome/hahatonka_topo_map.jpg
Thursday, September 16, 2010
Cartographic Animation
Cartographic Animation - Display visual changes of geospatial data of a specific region.
http://uwacadweb.uwyo.edu/JSHINKER/animations/global/
http://uwacadweb.uwyo.edu/JSHINKER/animations/global/gifs/vmag500winds_web.gif
http://uwacadweb.uwyo.edu/JSHINKER/animations/global/
http://uwacadweb.uwyo.edu/JSHINKER/animations/global/gifs/vmag500winds_web.gif
Mental Map
Mental Map - Maps from a persons point of view as they see the world.
http://www.uky.edu/~ulack/Geo152/
http://www.uky.edu/~ulack/Geo152/unnumbered%20figure%20pg%2003.jpg
http://www.uky.edu/~ulack/Geo152/
http://www.uky.edu/~ulack/Geo152/unnumbered%20figure%20pg%2003.jpg
Statistical Map
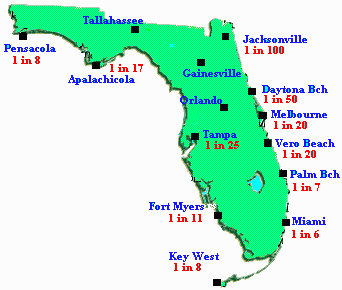
Statistical Map - Used to display a variables distribuition over a geographic region. They can also be displayed using shading techniques or colors to represent certain values.
http://www.floridahurricane.net/
http://www.floridahurricane.net/images/florida-hurricane-strikes-m.gif
http://www.floridahurricane.net/
http://www.floridahurricane.net/images/florida-hurricane-strikes-m.gif
PLSS Map
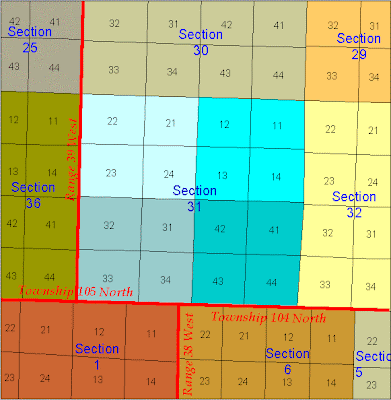
PLSS Map - Public Land Survey System - A way of describing and subdividing land in the US.
http://www.fairview-industries.com/standardmodule/mn-exmpl.htm
http://www.fairview-industries.com/standardmodule/mn-exmp2.gif
http://www.fairview-industries.com/standardmodule/mn-exmpl.htm
http://www.fairview-industries.com/standardmodule/mn-exmp2.gif
Thematic Map

Thematic Map -Emphasize a particular theme or a special topic.
http://www.creativemappingsolutions.com/maps/thematic/thematic1.html
http://www.creativemappingsolutions.com/maps/thematic/thematic_map_1-web.jpg
Planimetric Map
Planimetric Map - Display the horizontal position of planimetric features by usuing lines and symbols. They use an X,Y coordinate system to help the map reader. Horizontal distances are extremely accurate.
http://www.eserc.stonybrook.edu/Sayville/
http://www.chipr.sunysb.edu/eserc/Sayville/images/sayPlanMap.gif
http://www.eserc.stonybrook.edu/Sayville/
http://www.chipr.sunysb.edu/eserc/Sayville/images/sayPlanMap.gif
Propaganda Map

Propaganda Map -Used to persuade people in to believing on thing or another. These maps have become well known because of their used in WWI and WWII.
http://www.victoriansatwar.net/archives/maps_2.html
http://www.victoriansatwar.net/archives/pics/46.jpg
Cadastral Map
Cadastral Map - Displays exact descriptions of land plots. Plots are usually assigned names or numbers to identify the property. Scale is crucial for accurate identification of property in these maps.
http://www.dgs-gis.cz/mapy.php
http://www.dgs-gis.cz/images/bigones/katastralni.jpg
http://www.dgs-gis.cz/mapy.php
http://www.dgs-gis.cz/images/bigones/katastralni.jpg
DLG (Digital Line Graph)
DLG - Digital Lin Graph - Digital representation of features that are displayed on a US Geological Survey Topo Maps.
DRG (Digital Raster Graphics)

DRG - Digital Raster Graphics - Scanned images of US Geological Survey Topographic maps. Maps are scanned at a minimum resolution of 250 dpi. Maps are georeferenced to the Earths surface to fit the Universal Transverse Mercator Projection.
http://egsc.usgs.gov/isb/pubs/factsheets/fs08801.html
http://egsc.usgs.gov/isb/pubs/factsheets/fs08801.graphics/drg.jpg
Tuesday, September 7, 2010
Isopleths
Isopleths - simplifies and generalizes data with a continuous distribution and shows it as a third dimension on a map.
http://dwb4.unl.edu/chem/chem869v/chem869vlinks/weather.about.com/newsissues/weather/library/weekly/aa071600a.htm
http://dwb4.unl.edu/chem/chem869v/chem869vlinks/nadp.sws.uiuc.edu/isopleths/maps1998/so4.gif
http://dwb4.unl.edu/chem/chem869v/chem869vlinks/weather.about.com/newsissues/weather/library/weekly/aa071600a.htm
http://dwb4.unl.edu/chem/chem869v/chem869vlinks/nadp.sws.uiuc.edu/isopleths/maps1998/so4.gif
Isopach
Isopachs - a contour map that connects points of equal thickness. These usually refer to stratigraphic thickness of a rock group.
http://www.glossary.oilfield.slb.com/DisplayImage.cfm?ID=114
http://www.glossary.oilfield.slb.com/files/OGL98135.gif
http://www.glossary.oilfield.slb.com/DisplayImage.cfm?ID=114
http://www.glossary.oilfield.slb.com/files/OGL98135.gif
Isohyets
Isohyets - contour map connecting areas of equal precipitation.
http://www.virginiaplaces.org/climate/index.html
http://www.virginiaplaces.org/climate/graphics/isohyet.gif
http://www.virginiaplaces.org/climate/index.html
http://www.virginiaplaces.org/climate/graphics/isohyet.gif
Isotachs
Isotachs - A contour map that displays and connects like wind speeds.
http://www4.ncsu.edu/~nwsfo/storage/cases/20030123/
http://www4.ncsu.edu/~nwsfo/storage/cases/20030123/small.eta_12z_300_000hr.gif
http://www4.ncsu.edu/~nwsfo/storage/cases/20030123/
http://www4.ncsu.edu/~nwsfo/storage/cases/20030123/small.eta_12z_300_000hr.gif
Isobars
Isobars - Form of contour map that connects and displays like atmospheric pressure.
http://www.uwlax.edu/faculty/skala/Air-Pressure.htm
http://www.uwlax.edu/faculty/skala/Image58.gif
http://www.uwlax.edu/faculty/skala/Air-Pressure.htm
http://www.uwlax.edu/faculty/skala/Image58.gif
LIDAR
LIDAR - aka Light Detection and Ranging is a form of optical remote sensing and measures properties of scattered light to find range and other information about a distant target.
http://www.noaanews.noaa.gov/stories/s798.htm
http://www.noaanews.noaa.gov/stories/images/manhattan-lidar092701.jpg
LIDAR Image of Manhattan
http://www.noaanews.noaa.gov/stories/s798.htm
http://www.noaanews.noaa.gov/stories/images/manhattan-lidar092701.jpg
LIDAR Image of Manhattan
Doppler Radar
Doppler Radar - uses the Doppler Effect to radially track and measure an objects velocity.
http://www.noaanews.noaa.gov/stories2004/s2311.htm
http://www.noaanews.noaa.gov/stories2004/images/frances-radar-melbourne-fla-090404-0334z2.jpg
The above Doppler image is of Hurricane Francis which hit Florida's east coast September 4, 2004.
Black and White Aerial Photo
Black and White Aerial Photo - Photo displaying large tracts of land that was shot by a flying plane.
http://freegeographytools.com/2007/goofing-around-with-pan-sharpening
http://freegeographytools.com/wp-content/uploads/2007/09/doq-thumb.jpg
Infrared Aerial Photo
Infrared Aerial Photo - Infrared film only picks up light from a specific part of the spectrum. Its used to document changes in environment, wetlands and other geographic features.
http://www.aerialarchives.com/infrared.htm
http://www.aerialarchives.com/imagedb/IR0010154f.jpg
Isoline Map

Isoline Map - Uses contour lines to link like data. Can display elevation, population, rainfall, wind, etc.
http://legacy.sfei.org/ecoatlas/GIS/MapInterpretation/MapsandScales.html
http://legacy.sfei.org/ecoatlas/GIS/MapInterpretation/images/fig219.gif
Flow Map
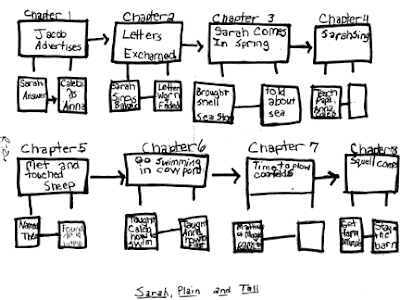
Flow Map - Shows the progression of ideas, people, and other objects from one place to another.
http://www.mapthemind.com/thinkingmaps/themaps/flow/index.html
http://www.mapthemind.com/thinkingmaps/themaps/flow/images/flow_chapters.gif
The above flow map depicts the chapter by chapter progression of the book "Sarah, Plain and Tall".
Proportional Circle Map
Proportional Circle Map - Information is displayed via the size of the circle.
http://www.creativeclass.com/creative_class/2009/08/
http://www.creativeclass.com/creative_class/_wordpress/wp-content/uploads/2009/08/bailoutmap11.jpg
Above Proportional Circle Map displays by state the amount of funds distributed under the bailout.
http://www.creativeclass.com/creative_class/2009/08/
http://www.creativeclass.com/creative_class/_wordpress/wp-content/uploads/2009/08/bailoutmap11.jpg
Above Proportional Circle Map displays by state the amount of funds distributed under the bailout.
Cartogram
Cartogram - The normal space of a map is distorted to display collected data about a geographical area.
http://www.longwood.edu/staff/hardinds/Politics/Smoke-free_Virginia/SmokeFree2009.htm
http://www.longwood.edu/staff/hardinds/Politics/Smoke-free_Virginia/Majority%20Non-Smoking%202009%20cartogram_jpg.jpg
The above is a cartogram of smoke free restaurants by county in Virginia.
http://www.longwood.edu/staff/hardinds/Politics/Smoke-free_Virginia/SmokeFree2009.htm
http://www.longwood.edu/staff/hardinds/Politics/Smoke-free_Virginia/Majority%20Non-Smoking%202009%20cartogram_jpg.jpg
The above is a cartogram of smoke free restaurants by county in Virginia.
Choropleth Map
Choropleth map - Provides an easy visualization of data measurement across a geographic region.
http://www.agcensus.usda.gov/Publications/2002/Ag_Atlas_Maps/Crops_and_Plants/index.asp - map #02-M259
http://www.nass.usda.gov/research/atlas02/Crops/Fruits,%20Tree%20Nuts,%20Berries,%20Nursery%20and%20Greenhouse%20Crops/Total%20Acres%20of%20Land%20in%20Orchards-choropleth%20map.gif
The above map displays total acres that were orchards in the US in 2002
Dot Distribution Map
Dot Distribution Map - Great for showing populations. There are 2 types a one to one dot and a one to many.
http://www.census.gov/geo/www/mapGallery/2kpopden.html
http://www.census.gov/geo/www/mapGallery/images/small2kden.jpg
The above map is a 1 to 7500 person dot distribution map of data collected during the 2000 US Census.
http://www.census.gov/geo/www/mapGallery/2kpopden.html
http://www.census.gov/geo/www/mapGallery/images/small2kden.jpg
The above map is a 1 to 7500 person dot distribution map of data collected during the 2000 US Census.
Hypsometric Map
Hypsometric Map - Shows elevation by means of shading and tinting.
http://igitur-archive.library.uu.nl/dissertations/2008-1010-200655/ - Annex 4A
http://igitur-archive.library.uu.nl/dissertations/2008-1010-200655/Annex4A.jpg
The above image is a hypsometric map of cuba at a 1:1,000,000 scale.
http://igitur-archive.library.uu.nl/dissertations/2008-1010-200655/ - Annex 4A
http://igitur-archive.library.uu.nl/dissertations/2008-1010-200655/Annex4A.jpg
The above image is a hypsometric map of cuba at a 1:1,000,000 scale.
Subscribe to:
Comments (Atom)


